Sikka 1

Sikka research reveals latest dental trends from across the U.S.

July 11, 2013
Sikka research reveals dental trends from across the United States from the first five months of 2013.

This white paper is based on real-time benchmarking data from thousands of opt-in practices and shows the trends from January 2013 to May 2013. There has been no comparable work done in the past that uses the real time benchmarking described here.

We have based our analysis on over 8,800 installations that include both solo and group practices. This article is a work in progress, and Sikka Software Corporation can provide more information and benchmarking data to those who are interested. This data is collected from a limited benchmarking set compliant with all privacy laws including HIPAA, and it doesn’t have any patient identifier data.

RELATED ARTICLE:Finding the fees in your zip code ... click here for free fee analyzer

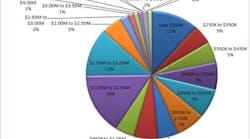
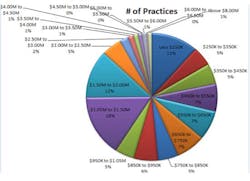
Here is the distribution of opt-in practices in the Sikka ecosystem. About 12% of practices make less than $250,000 adjusted production per year, and 12% make between $1.5M and $2.00M. In other words, the distribution is not toward high-end or low-end practices. About 50% of practices make less than $850K per year.
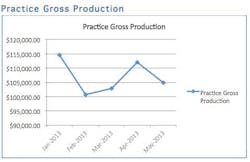
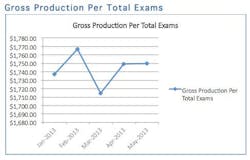
Average monthly practice gross production has dropped in May slightly compared to April.
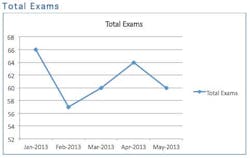
The total number of exams performed at a practice is an indicator of the treatment opportunities created and future business. A patient agreeing to get a dental exam at a practice is also the indicator of confidence that the patient has in his or her economic condition because the person is aware that additional money may have to be spent.
This indicator is steady and that is a good sign. It dropped slightly in March.
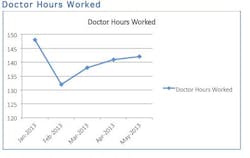
The dentist hours worked is holding steady.
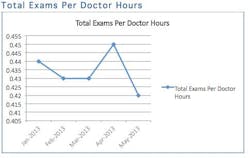
The number of exams per doctor hour peaked in April and then fell down in May to the lowest levels so far in the year. We will continue to monitor this trend carefully.
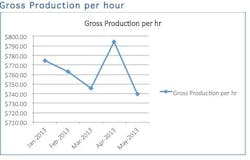
Gross production per hour also fell down in May compared to peak in April. The second quarter is not the best in terms of production per hour in a dental practice.

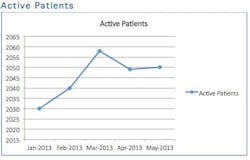
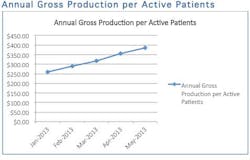
The number of active patients is holding steady as the indicator below is showing annual gross production per active patient is increasing. This indicates that practices are doing more to diagnose and perform treatments.

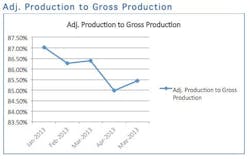
More adjustments (which could be discounts) are being handed out by dental practices as the year has gone by.
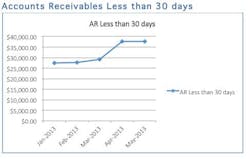
Again, more practices are accepting and accommodating that the patients don’t have to pay right away. More accounts receivable balances are being carried by practices.
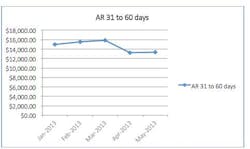
AR 31-60 is holding steady, showing good collection effort on the part of practices in the second quarter.
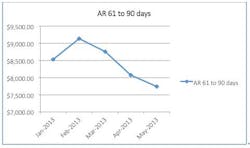
AR 61-90 is dropping after peaking in February because of good collection efforts on the part of practices. This shows the teams in dental offices are putting in an excellent effort toward collecting
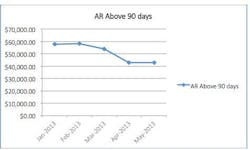
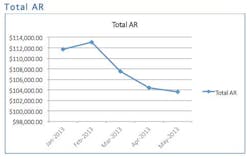
AR over 90 and Total AR reflects great effort on part of dental practices.
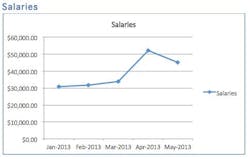
Average dental salaries for teams peaked in April and have seen a slight decline in May.

The Sikka software programs have never seen a practice make less than a $50K increase, and they include unlimited support with no contracts. Practice Optimizer helps you optimize your practice. Patient Home Page® is the ultimate patient reminder, with a patient portal and an optimizer for consultants that helps consultants and enterprises maximize their business with tools to advise hundreds of practices.

Sikka Software Corporation has a series of benchmarking and opt-in databases available, with key performance indicators for dental, veterinary, and audiology industries. If you are interested in using their Practice Optimizer program, you may download a free version by visiting monitor.sikkasoft.com.